- 适用于 JDK 24 的 GraalVM(最新)
- 适用于 JDK 25 的 GraalVM(早期访问)
- 适用于 JDK 21 的 GraalVM
- 适用于 JDK 17 的 GraalVM
- 存档
- 开发构建
分析命令行工具
GraalVM 性能分析命令行工具可帮助您通过分析 CPU 和内存使用情况来优化代码。
大多数应用程序将 80% 的运行时间花在 20% 的代码上。因此,为了优化代码,了解应用程序时间花费在哪里至关重要。在本节中,我们将使用一个示例应用程序来演示 GraalVM 提供的三种主要性能分析功能:CPU 跟踪器 (CPU Tracer)、CPU 采样器 (CPU Sampler) 和内存跟踪器 (Memory Tracer)。
此示例应用程序使用一个基于埃拉托斯特尼筛法的基本质数计算器算法。
-
将以下代码复制到一个名为
primes.js的新文件中class AcceptFilter { accept(n) { return true } } class DivisibleByFilter { constructor(number, next) { this.number = number; this.next = next; } accept(n) { var filter = this; while (filter != null) { if (n % filter.number === 0) { return false; } filter = filter.next; } return true; } } class Primes { constructor() { this.number = 2; this.filter = new AcceptFilter(); } next() { while (!this.filter.accept(this.number)) { this.number++; } this.filter = new DivisibleByFilter(this.number, this.filter); return this.number; } } var primes = new Primes(); var primesArray = []; for (let i = 0; i < 5000; i++) { primesArray.push(primes.next()); } console.log(`Computed ${primesArray.length} prime numbers. ` + `The last 5 are ${primesArray.slice(-5)}.`); - 运行
js primes.js。示例应用程序应打印如下输出js primes.js Computed 5000 prime numbers. The last 5 are 48563,48571,48589,48593,48611.这个程序需要一些时间来计算。接下来您将检查时间都花在了哪里。
- 运行
js --cpusampler primes.js以启用 CPU 采样。CPU 采样器应为示例应用程序打印如下输出js --cpusampler primes.js Computed 5000 prime numbers. The last 5 are 48563,48571,48589,48593,48611. ---------------------------------------------------------------------------------------------- Sampling Histogram. Recorded 250 samples with period 10ms. Self Time: Time spent on the top of the stack. Total Time: Time spent somewhere on the stack. ---------------------------------------------------------------------------------------------- Thread[main,5,main] Name || Total Time || Self Time || Location ---------------------------------------------------------------------------------------------- accept || 2150ms 86.0% || 2150ms 86.0% || primes.js~13-22:191-419 next || 2470ms 98.8% || 320ms 12.8% || primes.js~31-37:537-737 :program || 2500ms 100.0% || 30ms 1.2% || primes.js~1-46:0-982 ----------------------------------------------------------------------------------------------默认情况下,采样器会打印每个 JavaScript 函数的执行时间直方图。
您可以通过使用
--cpusampler=flamegraph选项生成 SVG 格式的火焰图js --cpusampler=flamegraph primes.js它应该生成一个名为
flamegraph.svg的文件,内容类似于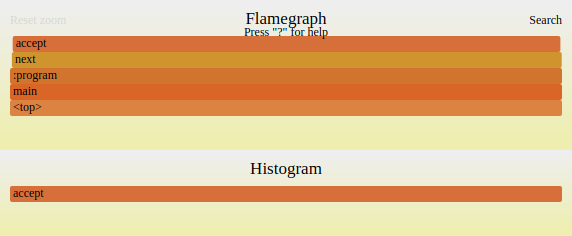
您可以通过点击元素来放大图表。
默认情况下,CPU 采样每 10 毫秒进行一次采样。从结果中,我们可以看到大约 89% 的时间花在
DivisibleByFilter.accept函数中。accept(n) { var filter = this; while (filter != null) { if (n % filter.number === 0) { return false; } filter = filter.next; } return true; }更多详细信息,请参阅这篇博客文章。
现在使用 CPU 跟踪器来收集每个语句的执行次数
- 运行
js primes.js --cputracer --cputracer.TraceStatements --cputracer.FilterRootName=*accept以收集以accept结尾的方法中所有语句的执行次数js primes.js --cputracer --cputracer.TraceStatements --cputracer.FilterRootName=accept Computed 5000 prime numbers. The last 5 are 48563,48571,48589,48593,48611. ----------------------------------------------------------------------------------------- Tracing Histogram. Counted a total of 468336895 element executions. Total Count: Number of times the element was executed and percentage of total executions. Interpreted Count: Number of times the element was interpreted and percentage of total executions of this element. Compiled Count: Number of times the compiled element was executed and percentage of total executions of this element. ----------------------------------------------------------------------------------------- Name | Total Count | Interpreted Count | Compiled Count | Location ----------------------------------------------------------------------------------------- accept | 234117338 50.0% | 365660 0.2% | 233751678 99.8% | primes.js~15:245-258 accept | 117053670 25.0% | 182582 0.2% | 116871088 99.8% | primes.js~16-18:275-348 accept | 117005061 25.0% | 181001 0.2% | 116824060 99.8% | primes.js~19:362-381 accept | 53608 0.0% | 1829 3.4% | 51779 96.6% | primes.js~14:211-227 accept | 53608 0.0% | 1829 3.4% | 51779 96.6% | primes.js~13-22:191-419 accept | 48609 0.0% | 1581 3.3% | 47028 96.7% | primes.js~17:322-334 accept | 4999 0.0% | 248 5.0% | 4751 95.0% | primes.js~21:402-413 accept | 1 0.0% | 1 100.0% | 0 0.0% | primes.js~2-4:25-61 accept | 1 0.0% | 1 100.0% | 0 0.0% | primes.js~3:45-55 -----------------------------------------------------------------------------------------输出显示每个语句的执行计数器,而不是时间信息。跟踪直方图通常能提供对需要优化算法行为的深入见解。
- 运行
js primes.js --experimental-options --memtracer以显示源代码位置和报告的分配计数。请注意,用于捕获分配的内存跟踪器工具目前是 GraalVM 中的一个实验性功能。因此,使用--memtracer之前必须加上--experimental-options命令行选项。js primes.js --experimental-options --memtracer Computed 5000 prime numbers. The last 5 are 48563,48571,48589,48593,48611. ------------------------------------------------------------ Location Histogram with Allocation Counts. Recorded a total of 5007 allocations. Total Count: Number of allocations during the execution of this element. Self Count: Number of allocations in this element alone (excluding sub calls). -------------------------------------------------------- Name | Self Count | Total Count | Location -------------------------------------------------------- next | 5000 99.9% | 5000 99.9% | primes.js~31-37:537-737 :program | 6 0.1% | 5007 100.0% | primes.js~1-46:0-982 Primes | 1 0.0% | 1 0.0% | primes.js~25-38:424-739 --------------------------------------------------------此输出显示每个函数记录的分配数量。对于计算出的每个质数,程序会在
next中分配一个对象,并在DivisibleByFilter的constructor中分配一个对象。无论编译器是否能消除这些分配,都会进行记录。GraalVM 编译器在优化分配方面尤其强大,可以将分配推入不常执行的分支以提高执行性能。GraalVM 团队计划未来在内存跟踪器中添加有关内存优化的信息。
工具选项 #
在所有客户语言启动器中使用 --help:tools 选项,以显示 CPU 采样器、CPU 跟踪器和内存跟踪器的参考信息。当前可用选项集如下。
CPU 采样器选项 #
--cpusampler=true|false|<Output>:启用/禁用 CPU 采样器,或使用特定输出启用 - 由 Output 选项指定(默认值:false)。使用此选项选择输出时,默认会将输出打印到标准输出流,但火焰图会打印到flamegraph.svg文件中。--cpusampler.Delay=<ms>:将采样延迟此毫秒数(默认值:0)。--cpusampler.FilterFile=<filter>:源文件路径的通配符过滤器。(例如,program.sl)(默认值:无过滤器)。--cpusampler.FilterLanguage=<languageId>:仅对给定 ID 的语言进行性能分析。(例如,js)(默认值:分析所有语言)。--cpusampler.FilterMimeType=<mime-type>:仅对给定 MIME 类型的语言进行性能分析。(例如,application/javascript)(默认值:分析所有语言)--cpusampler.FilterRootName=<filter>:程序根的通配符过滤器。(例如,Math.*)(默认值:无过滤器)。--cpusampler.GatherAsyncStackTrace=true|false:尝试为每个样本收集异步堆栈跟踪元素(默认值:true)。禁用此选项可能会减少采样开销。--cpusampler.GatherHitTimes:为每个采集的样本保存一个时间戳。--cpusampler.MinSamples=[0, inf):如果元素的样本数少于此值,则将其从输出中移除(默认值:0)--cpusampler.Output=histogram|calltree|json|flamegraph:将输出格式指定为以下之一:直方图、调用树、JSON 或火焰图(默认值:直方图)。--cpusampler.OutputFile=<path>:将输出保存到给定文件。默认情况下,输出会打印到标准输出流。--cpusampler.Period=<ms>:采样堆栈的周期(毫秒)(默认值:10)--cpusampler.SampleContextInitialization:启用对上下文初始化期间执行的代码的采样--cpusampler.ShowTiers=true|false|0,1,2:指定是否显示条目的编译信息。您可以指定“true”显示所有编译信息,“false”不显示任何信息,或者指定一个逗号分隔的编译层列表。注意:解释器被视为 Tier 0。(默认值:false)--cpusampler.StackLimit=[1, inf):最大堆栈元素的最大数量(默认值:10000)。--cpusampler.SummariseThreads:将输出打印为所有“每线程”配置文件的摘要。
CPU 跟踪器选项 #
--cputracer:启用 CPU 跟踪器(默认值:false)。--cputracer.FilterFile=<filter>:源文件路径的通配符过滤器。(例如,program.sl)(默认值:无过滤器)。--cputracer.FilterLanguage=<languageId>:仅对给定 ID 的语言进行性能分析。(例如,js)(默认值:无过滤器)。--cputracer.FilterMimeType=<mime-type>:仅对给定 MIME 类型的语言进行性能分析。(例如,application/javascript)(默认值:无过滤器)。--cputracer.FilterRootName=<filter>:程序根的通配符过滤器。(例如,Math.*)(默认值:无过滤器)。--cputracer.Output=histogram|json:以“直方图”或“JSON”形式打印输出(默认值:直方图)。--cputracer.OutputFile=<path>:将输出保存到给定文件。默认情况下,输出会打印到标准输出流。--cputracer.TraceCalls:跟踪时捕获调用(默认值:false)。--cputracer.TraceRoots=true|false:跟踪时捕获根(默认值:true)。--cputracer.TraceStatements:跟踪时捕获语句(默认值:false)。
内存跟踪器选项 #
内存跟踪器工具目前是一个实验性工具。确保使用 --experimental-options 标志作为前缀来启用 --memtracer。
--memtracer:启用内存跟踪器(默认值:false)。--memtracer.FilterFile=<filter>:源文件路径的通配符过滤器。(例如,program.sl)(默认值:无过滤器)。--memtracer.FilterLanguage=<languageId>:仅对给定 ID 的语言进行性能分析。(例如 js)(默认值:无过滤器)。--memtracer.FilterMimeType=<mime-type>:仅对给定 MIME 类型的语言进行性能分析。(例如,application/javascript)。(默认值:无过滤器)--memtracer.FilterRootName=<filter>:程序根的通配符过滤器。(例如,Math.*)(默认值:无过滤器)。--memtracer.Output=typehistogram|histogram|calltree:以“类型直方图”、“直方图”或“调用树”形式打印输出。(默认值:直方图)--memtracer.StackLimit=[1, inf):最大堆栈元素的最大数量。(默认值:10000)--memtracer.TraceCalls:跟踪时捕获调用。(默认值:false)--memtracer.TraceRoots=true|false:跟踪时捕获根。(默认值:true)--memtracer.TraceStatements:跟踪时捕获语句(默认值:false)。